"What's Your Favorite Problem Solving Tool?"

During a recent phone conversation with a colleague, Taylor C., she was describing some of the issues her Product Engineering business unit was dealing with – a disparate set of medium-complexity problems she felt were keeping her team from achieving the performance she wanted.
At one point she asked me the question in the title – “What’s your favorite problem solving tool?”
Before I could answer, she cut herself off saying something like, “Sorry, dumb question. You obviously know how to use all the Lean Six Sigma tools.”
That is true, but the point of the question is still valid – whenever the problem at hand is bigger than you can solve by yourself, it makes sense to have some way for your team to use facts and data to describe your current situation, desired future situation, and how to get from here to there.
I first told her that my favorite problem solving tool is the one that actually solves the problem. Unfortunately, I don’t ever know which one that is until after the work is done!
Several techniques may often be combined, each providing clues to the root cause and leading to fact-based decisions about the best corrective actions.
• The best problem solving tool to start
There is an argument to be made, though, that the best tool for beginning the problem solving process is the Ishikawa diagram, also known as Cause and Effect, or the colloquial “fishbone” since it resembles a fish skeleton. If Taylor and her engineers can improve their skill at applying that technique, it will go a long way to developing their problem-solving ability across a wide range of problems such as her business unit is dealing with.
She asked how to get started in using the technique, saying she had seen fishbone diagrams from time to time but had not been involved in their development. That’s quite common.
When you look at a completed fishbone diagram, it often looks like it was pretty simple to create; of course, the hours of team effort that went into its preparation are not visible.
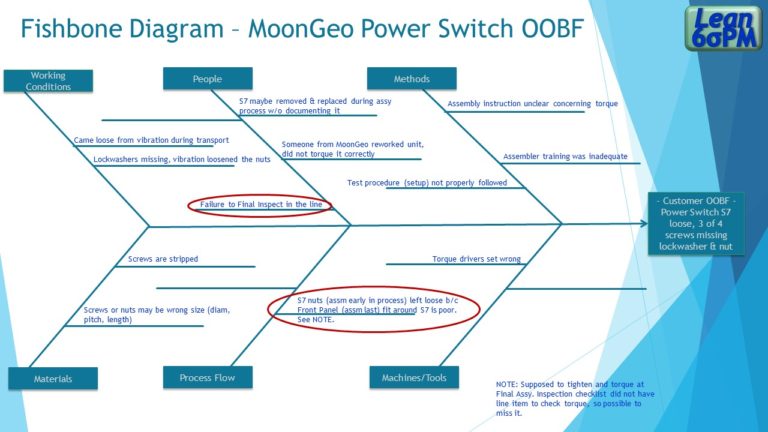
The illustration here, from an actual case involving a customer out-of-box failure (OOBF), shows the structure of the completed diagram. In that situation, the fishbone process involved people with varied skills and job roles, with 3 to 4 hours of dialogue focused just on the fishbone diagram and root cause determination.
• Ishikawa diagram, step by step
The first, non-trivial, step is to precisely define the problem you are trying to solve. You can’t solve a problem that you can’t define.
Write this on the right side at the head of the fish spine. A big part of the value of using the fishbone tool is it does not let you skip this step. Be specific, because if the problem definition is vague, the root cause determination will be difficult or impossible when the time comes.
Next, define the categories of possible causes for the major ribs extending from the spine. The six categories shown are generally useful, but these categories and the number 6 are not chiseled in stone. If a different category makes sense for you, substitute or add it; if one doesn’t apply to your situation, delete it.
You will most likely have several people involved in completing the fishbone, although there’s no rule about how many. I usually find a group of 7 to 12 with a mix of expertise and job roles works best.
You want people who have different perspectives on the problem, since you will be using one of the numerous brainstorming techniques to “flesh out the fish” with possible causes for the problem. Start with a round-robin approach, asking people in sequence to suggest a cause and recording it on whiteboard or flipchart. After two times around the table or conference call roster, I often shift to an open callout from anyone with a new idea.
It’s important when people are suggesting possible causes that you not bog down by analyzing them in real time, or by trying to decide in which category of the diagram they belong. Just record them as spoken, keep the session moving, let people feed off each other’s ideas, and return to the details after all participants have stopped suggesting. You are going to get some near-duplicates, and that’s okay; you can sort it out afterward.
Once the idea generation session is completed, take a short break before transferring the possible causes to the actual fishbone diagram (unless you have a fire-breathing customer in the VP’s office who wants answers NOW!). A break gives time for the ideas to gel a bit, and that can inspire other likely causes that hadn’t come up.
I’ve been in teams that enter the possible causes directly onto a template in Excel or Visio, and others that draw on a whiteboard, photograph it, and make it pretty later on. Either way works. Take the ideas one at a time, have the team decide which category it fits (People, Process, etc.), and enter them all. If two or more are closely related, it’s possible to combine the ideas into one entry.
• From possible to probable to root cause
After all entries have been transferred from list to fishbone, it’s decision time. Since you probably have identified 15 or more possible causes, it is not feasible to consider all of them to be root causes of the problem, nor to devise and implement corrective actions for all of them.
Ask yourselves which 2 or 3 are the most probable root causes of the problem and focus on those. Usually, narrowing it down will require a bit of additional investigation at the “gemba” — that’s Lean Six Sigma-ese for “where the real work happens.” For instance, a production test failure can be analyzed by retesting a failed unit, by simulating the failure conditions, or by checking similar product to determine if possible cause “X” is a probable cause, and finally a root cause.
In our illustration above, the two probable causes outlined in red were determined to be root causes by examining process instructions and interviewing technicians familiar with the product and process.
A problem properly stated is half-solved, according to a former IBM Plant Manager of mine. In the same vein, I will assert that when you have completed your Cause and Effect diagram and found Root Cause, you are 80% of the way to your solution.
The last 20% is the corrective action, which is a different set of skills and tools we will deal with in future segments. You can’t always get to 80% using only the Ishikawa technique, and there are many other Lean Six Sigma problem solving tools to address special circumstances.
Now that I read this vignette, maybe the Ishikawa diagram is in fact my favorite problem solving tool!
Taylor said she’d check back with me in a few weeks to let me know how she is faring using the Ishikawa technique, and I will publish her progress update.
Dann Gustavson, PMP®, Lean Six-Sigma Black Belt, helps Program Managers and their teams achieve superior results through high-impact program execution. Prepare, structure, and run successful programs in product engineering, manufacturing operations (including outsourcing), and cross-functional change initiatives.
Contact Dann@Lean6SigmaPM.com.