Lean Six Sigma PM Terminology - What and Why
CA/PA (Corrective Action / Preventive Action)
What – Actions determined based on definitive root cause analysis intended to correct the underlying reasons for a particular failure occurrence, as opposed to a simple “fix” performed without full understanding of the root cause.
Why is it important? – Whereas a correction or fix addresses the apparent failure of a unit of production, Corrective Actions address the identified root cause of the failure. Preventive Actions address broader potential failures similar to the one identified, on the same or related products or processes.
Cause and Effect diagram
> See Ishikawa diagram
Common Cause Process Variation
What? – Process variation is the unit-to-unit difference observed in measurements of parameters, variables, or attributes that occurs in all processes. The sources of variation include component dimensional tolerances, measurement precision, operator variability, machine variability, electronic part tolerances, ambient conditions of temperature, humidity, and pressure, and others. The sources of variation that cannot be separated out and identified are referred to as Common Cause variation.
See also Special Cause Process Variation.
Why is it important? – When analyzing a system or process for possible improvement, recognizing the underlying variability of the measured variables is important. The degree of common cause variation determines the capability of the process to produce units that meet specification or performance requirements. Process control charts can be constructed that track the variation and compute upper and lower control limits based on the existing common cause variation.
Cycle Time
What – The time duration for an operation or for a series of operations that constitute a process. If an operation has a cycle time of 4 minutes, for example, then that operation can process 15 units per hour.
Why would I use it? – The cycle time is directly related to production output for an operation or for the process (series of operations). Longer cycle times relate to higher labor cost and/or machine cost per unit.
DMAIC
What? – One of the fundamental structures in the Six Sigma methodology designed to effect change in a process or system. The acronym stands for Define, Measure, Analyze, Implement (or Improve), Control. Step 1 is to Define and quantify the desired outcome. Step 2 is Measuring the current state to establish a baseline of performance of the process. Next, Analyze the measurements and the characteristics of the existing process. Step 4 is to Implement a change that is expected to improve the process. And lastly, provided the change that was implemented did in fact improve the process, establish a method for Control of the new system.
Why is it important? – Although the execution will vary depending on the nature of the system or process in question, the 5 steps provide a consistent framework for ongoing change that drives continuous improvement. Starting with definition and measurement helps ensure that once the system is changed, the improvement can be quantified and that further changes can be designed, implemented, and controlled.
DPM and DPMO
What – Defects per Million (DPM) and Defects per Million Opportunities (DPMO) are measures of defect rates in products and processes. Here’s an example to illustrate. If we consider a finished product in its final acceptance test, the test failure rate (expressed as DPM) is the number of product units that failed test divided by the number tested, x 1,000,000. Furthermore, each unit of product has many opportunities for defects – each component could be defective, each interconnection could be defective, etc. Then, the intrinsic defect rate of the process (expressed as DPMO) equals the number of defective units divided by (units tested x defect opportunities per unit) x 1,000,000.
Extending the example, assume the product has 75 components and 15 interconnections. The test population is 1,000 units, and 3 units fail the test. Then,
DPM = (3 / 1000) x 1,000,000 = 3,000 DPM
DPMO = (3 / (1000 x (75 + 15))) x 1,000,000
= (3 / 90,000) x 1,000,000 = 33.3 DPMO
The first quantity (DPM) is the failure rate of the test. The second quantity (DPMO) is the intrinsic defect rate of the process for this product.
Why is it important? – Lean 6Sigma emphasizes fact-based data-driven decision making. When trying to measure very low defect rates, expressing them as percentages becomes unwieldy. In the example, the rates expressed as percentages would be 0.3% (for 3,000 DPM) and 0.00333% (for 33.3 DPMO). So DPM and DPMO are used for clarity and to facilitate improvement.
If we are working to achieve a 6-Sigma process, we would strive for an intrinsic defect rate of 3.4 DPMO, or about a 10x reduction from the defect rate in the example. We would further analyze the test data looking at top sources of defects (using a Pareto diagram), working to discover root causes of the defects, and then improving the product design or process to eliminate those sources.
Fishbone diagram
> See Ishikawa diagram
FMECA
What? – An analytical method of forecasting product reliability by identifying potential failures in system components and their effects on system performance. Stands for Failure Modes, Effects, and Criticality Analysis.
Frequently specified as Design (DFMECA) or Process (PFMECA), as applied to product design or manufacturing processes.
Why is it important? – By understanding the potential for defects and the subsequent system failures, design or process mitigations may be developed during the product development phase, thereby improving reliability of the product at the time of customer launch.
Gage R&R
What – “R&R” stands for Repeatability and Reproducibility. For an inspection gage or a test process algorithm making measurements on parts or assemblies to determine fitness for use (pass-fail), it is important to know how much variability exists in the measurement itself. A Gage R&R analysis performs multiple measurements on the same set of parts or assemblies to determine if the measurement variability affects the pass-fail outcome of the inspection.
Why is it important? – When a unit of product is measured and compared to a specification limit, excessive measurement variation can result in passing units which should be failed, and vice versa. False passes are considered process escapes, and possibly latent failures in downstream operations or customer use. False failures add unnecessary cost to the process, due to extra handling required to deal with repair or replacement of units which are in fact not defective.
Gemba
What – A Japanese word derived from the Toyota Production System lexicon, the source of much Lean 6Sigma vocabulary. Multiple definitions or English translations exist. The one I like best is “the place where the work happens.” The gemba will be different for different functions or workstreams. For Production, the gemba will be the manufacturing floor. For new product Development Engineering, the gemba consists of the labs in which designs are tried and tested, and the space where product design engineers and support staff conduct their CAD designs, simulation, documentation, and configuration.
Why is it important? – For the most effective continuous improvement, Lean 6Sigma practitioners recognize that the people in the gemba, who actually do the value-added work, are the most critical resource to involve for identifying where improvement is needed and for working on improvement teams. Hence, you’ll frequently hear a Lean 6Sigma Black Belt say “We need to go to the gemba” to see what is actually happening in the process, rather than relying on written procedures or idealized flow charts.
Heijunka
What? – Roughly translates to “level loading” or balancing the production process, or striving to make all operation steps equal in processing time.
Why is it important? – If sequential operations in a production process have different cycle times, the variation in time creates difficulty in managing the output from the line to meet demand. Equalizing operation cycle times can be done by splitting operations into two or more simpler steps, by duplicating stations, moving some preparatory operations offline, or by other means. Balanced lines have less variation among process steps, and are therefore more predictable and simpler to manage.
Ishikawa diagram
(also Cause and Effect; Fishbone)
What – A diagram used in problem-solving for identifying possible causes of an observed defect or failure, in order to determine its root cause. Categories of causes such as People, Process Flow, Materials, and so forth, are established. People familiar with the defect conduct a brainstorming session to consider many possible causes, which are placed appropriately on the diagram. Analytical methods are used to identify the most probable cause(s) from among the possibilities, leading to the root cause.
Why is it useful? – The methodology is an effective method of discovery of root cause(s) of identified defects, for follow-up determination of countermeasures or corrective actions.

Jidoka
What? – Sometimes referred to as “autonomation” or “Automation with a human touch,” jidoka refers to the practice of stopping the production line when a defect or anomaly is detected at an operation.
Why is it important? – In a lean production process, with little work-in-process (WIP) inventory ahead of stations, product can flow readily from start to finish based on downstream signals. If a defective part or assembly is found at an operation step, stopping the line prevents that defect from progressing further. Technicians can then analyze and resolve or correct the problem, and resume production.
Kaizen
What – A Japanese term from the Toyota Production System lexicon often used to signify the concept of continuous improvement. A better translation may be “Break down to make better.” A kaizen activity or project is intended to improve an important piece of a production process or a business process, with a few days’ effort, through the use of the Plan-Do-Study-Adjust cycle applied to the process step.
Why is it important? – Kaizen is usually performed by first analyzing the elements that make up a process step and then looking for ways to eliminate elements that are unnecessary or counter-productive, and recombining the needed elements to make the process faster or able to produce more consistent output (reduce variation).
Non Value-Add (NVA)
What? – Non Value-Add operations in a production or business process are operations that do not increase the tangible value of product and which customers, if asked, would be unwilling to pay for. The Toyota Production System (TPS) identifies NVA as Waste. NVA includes elements such as wasted motion in a process step, excessive inventory, over-production, and transport or movement of partially assembled product to and from storage. See also “Value-Add.”
Why is it important? – Understanding of the NVA concept helps production identify aspects of the overall process that can be eliminated or substantially reduced without detracting from the quality or performance of the product or process. Eliminating sources of NVA will typically increase process thruput.
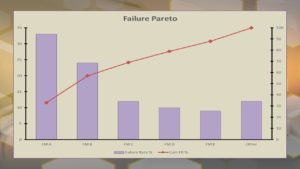
Pareto diagram
What – An enhancement to the histogram chart, it is used to depict the frequency of occurrence of different types of defects or failure modes in a manufacturing or test process, ordered from highest to lowest. It’s usually expressed in percentage of total defects. The defect histogram is plotted with the failure modes arrayed along the X axis, against the frequency of occurrence on the left-hand Y axis. The Pareto chart also includes a line graph plotted using the right-hand Y axis, showing the cumulative percentage of defects or failure modes.
Why is it useful? – One important method of process improvement is defect elimination, using root cause analysis and corrective action to eliminate the causes of identified defects. Typically, about 80% of the total defects will be the result of 20% of the unique defect causes. The line graph allows the analyst to see quickly how many and which failure modes make up 80% of the total, exemplifying the Pareto principle (often colloquially called the 80-20 rule).
Poka Yoke (a.k.a. Error Proofing)
What – An approach to process and product design with the objective of preventing errors by only allowing one way of assembling a unit. An example is the use of a tab and slot in two mating connectors which does not permit the connectors to mate in the wrong orientation. Other common methods of poka yoke are use of asymmetry, color coding for parts which look similar, and orientation markings on components.
Why would I use it? – Preventing errors in a process is preferable to inspecting for errors after the fact, since allowing errors reduces process quality and adding inspections adds cost. Consider poka yoke to address the root cause of common workmanship errors in an assembly and test process.
Process Yield
What – For a process or a process operation, Process Yield is the ratio of units which pass all required inspections and tests to the total number of units assessed. It is usually expressed as a percentage, for example, 98.5% Yield. Distinctions are often made for related measures such as:
First-pass Yield: The ratio of passing units to total units the first time they are tested.
Thruput Yield: The product of multiplying successive operation first-pass yields together to see the effect on the entire process. Example – a process consisting of 3 successive inspection or test steps has yields of 95%, 92%, and 97% for operations 1, 2, and 3 respectively. The Thruput Yield is (.95)x(.92)x(.97) = 0.85 or 85%.
Why is it important? – Yield is one way of assessing the quality of product and process for manufacturing and other business processes as well. By monitoring yields and their change from day to day, the effect of improvement activities can be seen. Process Yield is the highest level quality metric for many processes, and is the starting point for improvement efforts, although many lower level parametric measurements are usually needed in order to drive significant improvement.
Special Cause Process Variation
What? – Process variation is the unit-to-unit difference observed in measurements of parameters, variables, or attributes that occurs in all processes. The sources of variation include component dimensional tolerances, measurement precision, operator variability, machine variability, electronic part tolerances, ambient conditions of temperature, humidity, and pressure, and others. The sources of variation that do not occur routinely, and that can be separated out and identified, are referred to as Special Cause variation.
See also Common Cause process variation.
Why is it important? – When analyzing a system or process for possible improvement, recognizing the underlying variability of the measured variables is important. When an abnormal amount of variation is observed, the cause is said to be a Special Cause, possibly an unexpected defect source that results in a dimensional or performance failure. When such a failure is observed, failure analysis to determine the root cause is advisable, in order to identify and remove the special cause and restore process performance.
Process control charts that track the process variation and compute upper and lower control limits will show data points outside or very near the control limits when a special cause of variation is introduced into the process.
Note, it is also possible for a special cause to result in improved performance, in which case it is advisable to analyze and determine the root cause in order to maintain the observed improvement.
Root Cause (RC); RC Analysis
What – Root Cause is the underlying physical defect or anomaly determined to be the specific reason for a product or process to exhibit an undesired symptom, or failure. RC Analysis is the process of working from failure symptoms and “drilling down” to determine the most likely cause or causes for a product or process to exhibit the undesired symptom.
Why is it important? – If the root cause is known to a high degree of certainty, based on quantitative analysis and knowledge of expected system behavior, then corrective and preventive actions can be devised to ensure that the underlying cause can be removed from the product or process.
Takt Time
What – The word ‘takt’ is the German word for pulse. In a production process, the Takt Time is the amount of time required to produce one unit, and which will allow producing the total schedule for the day or shift. An example illustrates. Suppose a shift is 10 hours, equal to 600 minutes. If the scheduled output for that shift to meet customer demand is 120 units, then the takt time is equal to 600 minutes divided by 120 units, or 5 minutes. This can be thought of as the pulse of the production process.
Why is it important? – The Lean Six Sigma framework makes use of the concepts of single-piece flow, line balancing, and avoidance of under- and over-production. Knowing the required takt time helps the process managers optimize the flow of product from one step to the next, keeping each operation cycle time at or below the takt time. If a particular operation’s cycle time exceeds the takt time, it will constrain the output of the process (be a “bottleneck”). Either that operation’s cycle time must be reduced, or two or more identical workstations must be established to relieve the constraint.
Value-Add (VA)
What? – This term refers to process steps that customers would be willing to pay for, given the choice. In a production process, combining two or more components together into a subassembly, combining two or more subassemblies into a higher level assembly, downloading firmware to memory, and similar process steps are considered Value-Add. A similar analysis can be done for non-production business processes. See also “Non Value-Add.”
Why is it important? – Minimizing cost in production or in business processes requires an understanding and focus on value, in order to determine a profitable price point. Value-Add process steps are those which cannot be eliminated to reduce costs.
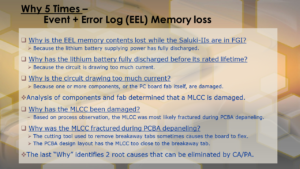
Why 5 Times (a.k.a. 5-Why; a.k.a. Why-Why)
What – An investigation technique used in root cause analysis, in which the high-level failure symptom is identified, followed by the question, Why?, to identify a first level possible cause for the observed failure. After establishing the first response, the question, Why?, is asked again in order to identify possible reasons for that observation. The process continues until the response is a high-probability root cause for which corrective and preventive actions can be taken. The number “5” is not mandatory; often the root cause will be apparent after fewer iterations, and sometimes more than 5 are required.
Why would I use it? – Frequently, failures identified by a test or inspection system are actually symptoms of an anomaly or defect which is not easily identifiable. “Why 5 Times” provides a methodical approach to root cause determination, particularly when used in a focused effort by a team with knowledge of the product, process, or technologies involved.